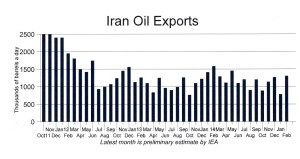
 Iranian oil exports plummeted in January to their lowest since tough sanctions were imposed, but they zoomed up in February to one of the highest monthly export totals of recent years.
Taken together, exports over the two months averaged 1,040,000 barrels a day, or in line with exports since the sanctions crunch began. (See chart below.)
All in all, the new figures from the Paris-based International Energy Agency (IEA) showed that sanctions were holding.
The United States has been trying to hold Iranian oil exports between 1.00 and 1.10 million barrels a day. The IEA said the average for 2014 was within that range at 1.09 million. Before the sanctions clamped down, Iran had been exporting an average of 2.5 million barrels a day for decades. So the sanctions have cut exports by more than 55 percent.
The figures used for the most recent month—in this case February—are estimates from industry reports. They are then updated the next month with official figures.
India, which was importing Iranian oil in large quantities last year, has sharply cut back, apparently after warnings from the United States. India imported a mere 90,000 barrels a day in January and February, the IEA said.
China remains by far the biggest buyer of Iranian crude, taking more than half of Iran’s exports in January and February.
The following table shows the quantities bought in the last two months by Iran’s few remaining customers. It is in thousands of barrels a day.
Client Feb Jan
China 600 470
India 90 90
Japan 270 180
S.Korea 140 60
Turkey 100 100
Taiwan 70 0
Syria 30 80
Total 1300 780
While Syria is an importer, it is not believed to be a paying customer. The Syrian oil is part of Iran’s war costs for supporting the regime there against rebels.
The Islamic Republic now is able to include in its oil exports much greater shipments of condensate, which is ultra light oil being produced along with the gas pumped from the South Pars gasfield. The IEA said Iran’s condensate exports averaged 85,000 barrels a day in 2013, but then more than doubled to 190,000 last year. They were at to 180,000 in January, but for some reason fell precipitously to just 90,000 in February.
But such month-to-month variations are not really important. A single tanker shipment delayed from the last day of one month to the first day of the next month can make recorded deliveries show dramatic changes, as in the January and February figures in the table above. But the average for the two months shows no real shift at all.
The IEA is an organization of 29 oil importing countries and is something of the mirror opposite of OPEC, the Organization of (12) Oil Exporting Countries.


