January 10-2014
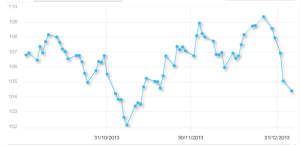
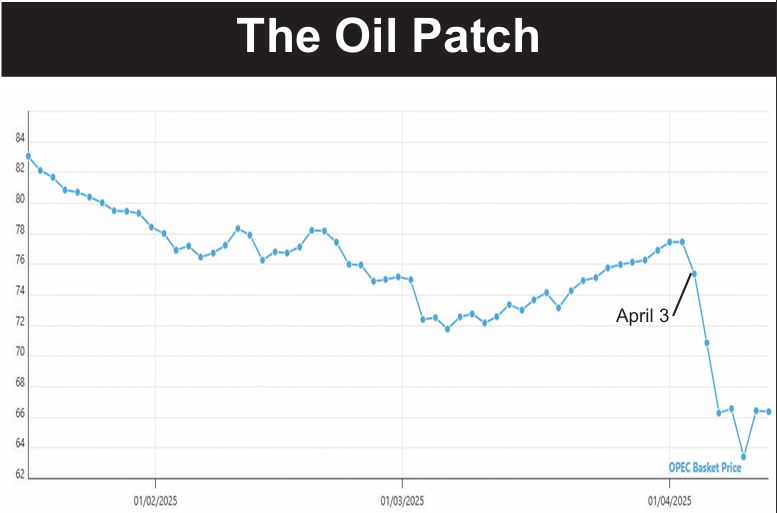
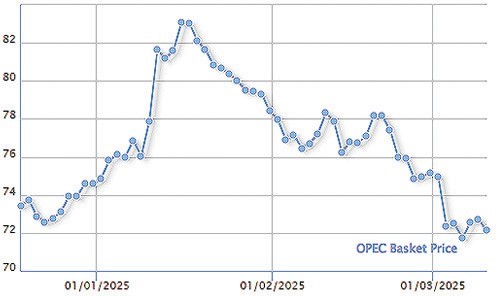
ANNUAL REPORT — The New Year began with the price of an OPEC barrel plunging almost $5 or 5 percent in just five trading days (above). Is this a sign of a bear market in 2014? Probably not. A glance over to the left on the chart above shows a similar $5 plunge over five days several weeks ago. The chart below shows the annual OPEC average each year in this century. The price seems to be in a real rut, despite all the ups and downs seen in the daily price. The average price in 2011 was $107.46, followed by $109.45 in 2012, $105.87 in 2013 and $105.46 in the first week of 2014.


