January 03-2014
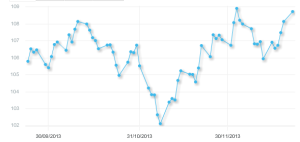
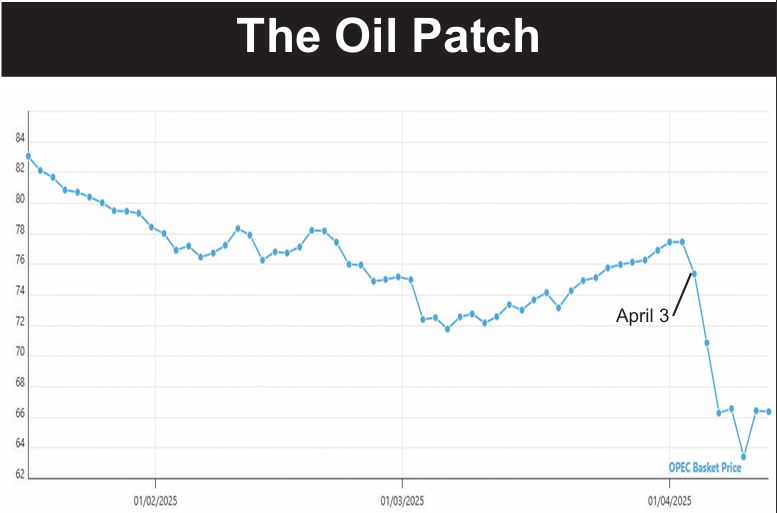
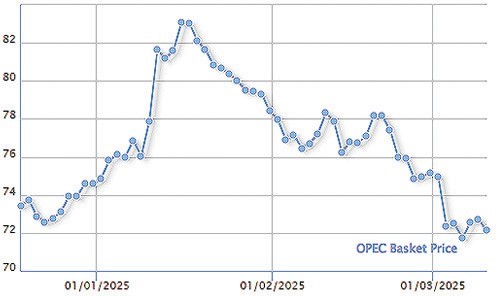
UPS AND DOWNS — The daily price of an OPEC barrel (above) continues flailing about. But let’s take a look at the really big picture—the average annual price (below). That chart is missing the last few days of 2013, which won’t change the average consequentially. The average for 2013 is down, but only marginally from 2012 and 2011. The point is that the price has been both steady and very HIGH for three years running. In this era of reduced oil exports, note that in the first three years on this chart, the price averaged around $25 a barrel with exports of 2.5 million barrels a day. For the last three years, the price has been above $105 a barrel with exports this past year of 1 million barrels a day. Do the math. That means total revenues today—even with reduced exports—are two-thirds higher than at the start of the decade (not allowing for inflation). That raises some real questions about how the economy is managed.


